Wed 12.7.11
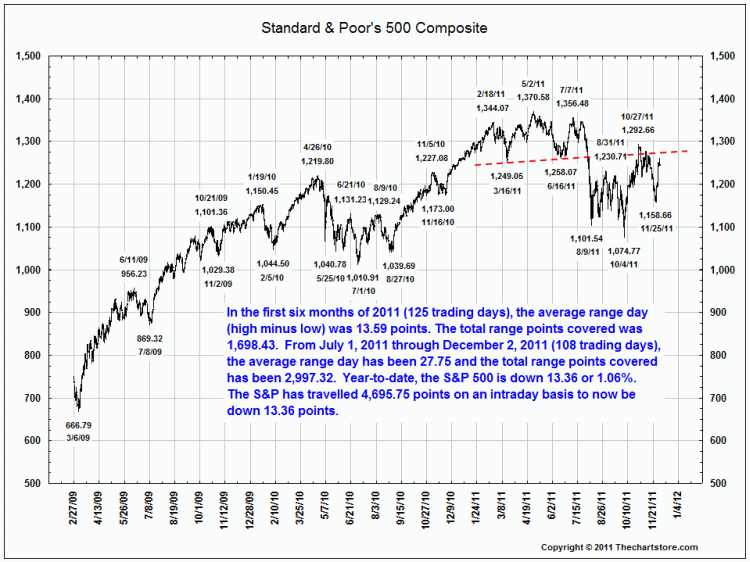
For my quick hitter today, I provide a chart from Ron Griess of the ChartStore, which illustrates how many points the S&P 500 has moved this year. As an example, if the S&P 500 moves up 15 points on Monday and down 10 points the next day, then it has moved 25 points, but on a net basis has only moved 5 points.
Using that logic, since July 1st, the S&P 500 has moved nearly 3,000 points, and almost 5,000 points since January 1st, yet for the year it is almost completely flat, just up 0.1%.
No comments:
Post a Comment