It's been a while, but here's my last comment of the year. As I predicted December has seen a nice Santa Claus rally to end the year. Yesterday's volume was the lightest traded day of the year, so you can expect more of the same heading into the last couple of trading days. One tidbit I thought was interesting, courtesy of the WSJ, is that during the Dow's 115 year history, the Dow has risen 80% of the time over the final five trading days, registering an average gain of 1.2% over those final five days. Looking at the S&P 500, the index has risen during the last week of the year 77% of the time, averaging a 0.9% gains, which compares to average gain of 0.15% for all weeks since 1928. Of course, with today's down day, led by banking and energy stocks, we are in danger of ending the last week in the red.
Lastly, on a positive note to begin 2012, courtesy of Kathy Lien at GFT Advisors, stocks usually perform well in election years --–and, over the past five decades, stocks fell only four out of the 17 presidential-election years. (With 2008 being the outlier due to the banking and credit crisis)
Sunday, February 5, 2012


Thurs 12.22.11
Surprising that treasuries would be trading higher today, as the equity markets are showing strength this morning, up 0.5% while the 10-year bond is now at 1.94%....so who's right? Typically the best bet is to listen to the bond market, but in this case I think the equity market is correct. I think today's the last day we will see much volume, and with today's rise, I would expect to see more of the same as the Santa Claus rally continues into the year, albeit at a lower pace than we would have liked to see.
Here are 4 points on why we should listen to the equity market today:
- Encouraging Drop In Weekly Jobless Claims - New U.S. claims for unemployment benefits dropped last week to its lowest in more than 3-1/2 years, suggesting the labor market recovery was gaining speed. Initial claims for state unemployment benefits dropped 4,000 to a seasonally adjusted 364,000, the Labor Department said. That was the lowest level since April 2008.
- Downward Revision To 3Q GDP But Data Points To Positive Growth Trends - U.S. economic growth was slower than previously estimated in the third quarter on a sharp drop in healthcare spending, but stronger business investment and a fall in inventories pointed to a pickup in output in the current period. Gross domestic product grew at a 1.8 percent annual rate in the third quarter, the Commerce Department said in its final estimate, down from the previously estimated 2 percent. Economists had expected growth to be unrevised at 2 percent. Though spending on healthcare dropped by $2.2 billion, spending on durable goods was stronger than previously estimated, indicating household appetite to consume remains healthy.
- Surprise Jump In Consumer Confidence - U.S. consumer sentiment improved in December to its highest level in six months as Americans felt better about the economy's prospects for the year ahead, a survey released on Thursday showed. The Thomson Reuters/University of Michigan's final reading on the overall index on consumer sentiment rose to 69.9 from 64.1 in November. It topped the median forecast of 68.0 among economists polled by Reuters and beat December's preliminary figure of 67.7.
- Strong Leading Indicators Data - U.S. NOV LEADING ECONOMIC INDICATORS +0.5 PCT (CONSENSUS +0.3 PCT) VS OCT +0.9 PCT
Here are 4 points on why we should listen to the equity market today:
- Encouraging Drop In Weekly Jobless Claims - New U.S. claims for unemployment benefits dropped last week to its lowest in more than 3-1/2 years, suggesting the labor market recovery was gaining speed. Initial claims for state unemployment benefits dropped 4,000 to a seasonally adjusted 364,000, the Labor Department said. That was the lowest level since April 2008.
- Downward Revision To 3Q GDP But Data Points To Positive Growth Trends - U.S. economic growth was slower than previously estimated in the third quarter on a sharp drop in healthcare spending, but stronger business investment and a fall in inventories pointed to a pickup in output in the current period. Gross domestic product grew at a 1.8 percent annual rate in the third quarter, the Commerce Department said in its final estimate, down from the previously estimated 2 percent. Economists had expected growth to be unrevised at 2 percent. Though spending on healthcare dropped by $2.2 billion, spending on durable goods was stronger than previously estimated, indicating household appetite to consume remains healthy.
- Surprise Jump In Consumer Confidence - U.S. consumer sentiment improved in December to its highest level in six months as Americans felt better about the economy's prospects for the year ahead, a survey released on Thursday showed. The Thomson Reuters/University of Michigan's final reading on the overall index on consumer sentiment rose to 69.9 from 64.1 in November. It topped the median forecast of 68.0 among economists polled by Reuters and beat December's preliminary figure of 67.7.
- Strong Leading Indicators Data - U.S. NOV LEADING ECONOMIC INDICATORS +0.5 PCT (CONSENSUS +0.3 PCT) VS OCT +0.9 PCT
Wednesday, December 7, 2011
Wed 12.7.11
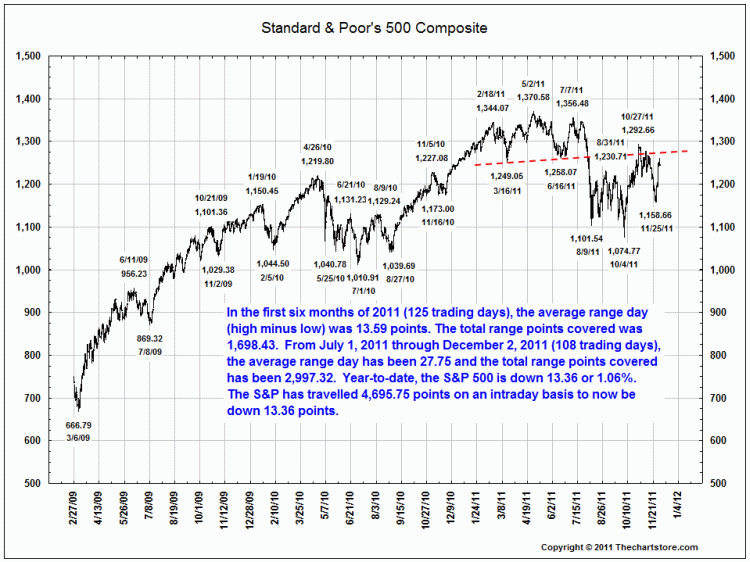
For my quick hitter today, I provide a chart from Ron Griess of the ChartStore, which illustrates how many points the S&P 500 has moved this year. As an example, if the S&P 500 moves up 15 points on Monday and down 10 points the next day, then it has moved 25 points, but on a net basis has only moved 5 points.
Using that logic, since July 1st, the S&P 500 has moved nearly 3,000 points, and almost 5,000 points since January 1st, yet for the year it is almost completely flat, just up 0.1%.

Using that logic, since July 1st, the S&P 500 has moved nearly 3,000 points, and almost 5,000 points since January 1st, yet for the year it is almost completely flat, just up 0.1%.
Tuesday, December 6, 2011
Tues 12.6.11
For today's comment I bring in Wall Street's bullish 2012 estimates and briefly discuss everyone's favorite topic...Europe
If you remember, a month or so ago, when they announced the 50% haircut on European debt, I noted that there would be some unintended consequences if they did not consider this haircut a "credit event", which would have triggered credit default swaps. Well, the ISDA ruled this was not a "credit event" because it was "voluntary" (sort of like someone holding a gun to your head, then asking you to voluntarily give them your wallet). Now the unintended consequences are beginning to materialize as investors are asking for a much higher return from European countries, as they can't "hedge" their position with credit default swaps. This is across the board, at both the stronger countries (Germany, Belgium) and the weaker countries (Spain, Italy).
Also, I want to point out that with yesterday's announcement from S&P that they were putting Eurozone countries on credit watch, this could mean big problems for Euro banks which are far larger (assets as a % of GDP) then American banks. Cutting the countries sovereign ratings will increase bank funding costs, at a time when people are already nervous of the safety and soundness of these banks in Europe. Once again, starting to play out like it did in 2008 in US...
Here's a quick snapshot of Wall Street's S&P 500 2012 target. Once again, the analysts are bullish, and all of them believe if Europe can have a moderate downturn that we could see some real price improvement next year. Couple of things to note.....1st point, there isn't that much disparity in the operating EPS from the analysts, but the biggest factor in the 2012 target is the forward P/E multiple they place on the earnings. For instance, BASML has a lower operating EPS than GS, but their price target is 100 points higher. My 2nd point is that although this isn't reflected in the chart, this is each analysts base forecast, but when you look at their bearish estimates, S&P target moves down to 900 - 950 for almost all of the ones that provided this detail. So, once again, as long as the US can keep chugging along, Europe can get its act together and China doesn't have a "hard landing", we could see 3 straight years of price appreciation (assuming we end this year in the black).

If you remember, a month or so ago, when they announced the 50% haircut on European debt, I noted that there would be some unintended consequences if they did not consider this haircut a "credit event", which would have triggered credit default swaps. Well, the ISDA ruled this was not a "credit event" because it was "voluntary" (sort of like someone holding a gun to your head, then asking you to voluntarily give them your wallet). Now the unintended consequences are beginning to materialize as investors are asking for a much higher return from European countries, as they can't "hedge" their position with credit default swaps. This is across the board, at both the stronger countries (Germany, Belgium) and the weaker countries (Spain, Italy).
Also, I want to point out that with yesterday's announcement from S&P that they were putting Eurozone countries on credit watch, this could mean big problems for Euro banks which are far larger (assets as a % of GDP) then American banks. Cutting the countries sovereign ratings will increase bank funding costs, at a time when people are already nervous of the safety and soundness of these banks in Europe. Once again, starting to play out like it did in 2008 in US...
Here's a quick snapshot of Wall Street's S&P 500 2012 target. Once again, the analysts are bullish, and all of them believe if Europe can have a moderate downturn that we could see some real price improvement next year. Couple of things to note.....1st point, there isn't that much disparity in the operating EPS from the analysts, but the biggest factor in the 2012 target is the forward P/E multiple they place on the earnings. For instance, BASML has a lower operating EPS than GS, but their price target is 100 points higher. My 2nd point is that although this isn't reflected in the chart, this is each analysts base forecast, but when you look at their bearish estimates, S&P target moves down to 900 - 950 for almost all of the ones that provided this detail. So, once again, as long as the US can keep chugging along, Europe can get its act together and China doesn't have a "hard landing", we could see 3 straight years of price appreciation (assuming we end this year in the black).
Mon 12.5.11
Looks like it's risk-on today as European investors cheer the news that Merkel and Sarkozy are meeting to discuss a plan for stability in the EU (didn't we just go through this same thing 2-3 weeks ago??) EU leaders are considering a plan that would bring stricter budgets to each of the countries in the EU (read: austerity measures), leveraging of the EFSF (European Financial Stability Facility) to a maximum of 1 trillion Euro of first loss guarantees on sovereign debt and an IMF (International Monetary Fund) bailout of b/w $100 - 200B Euro. While I believe it's good that they are starting to actually look at measures to stop the contagion, I have a couple of reservations, in particular with the IMF bailout. For one, the US comprises 20% of the IMF's budget, and I think politically, it would be very difficult to go along with a bailout of Europe when we still have persistently high unemployment (albeit somewhat improving) and although we have some economic growth, it doesn't necessarily "feel" like we are in a growing economy.
Day 4 of my rally into the year-end thesis: We currently have a backdrop of improving retail sales (3-4%), modestly improving employment picture, and an uptick in consumer sentiment. Institutional investors are still weary and are on average 60-70% in equities, so they are desperate to move the needle higher before December 31st, a typically strong month for stocks. Offsetting these positives that are earnings at a cyclical peak, negative income numbers, weak volume on rallies, a dysfunctional government, and an ongoing global deleveraging, but I think these bearish points will take a back seat until next year....
Day 4 of my rally into the year-end thesis: We currently have a backdrop of improving retail sales (3-4%), modestly improving employment picture, and an uptick in consumer sentiment. Institutional investors are still weary and are on average 60-70% in equities, so they are desperate to move the needle higher before December 31st, a typically strong month for stocks. Offsetting these positives that are earnings at a cyclical peak, negative income numbers, weak volume on rallies, a dysfunctional government, and an ongoing global deleveraging, but I think these bearish points will take a back seat until next year....
Friday 12.2.11
The jobless rate declined to 8.6 percent, the lowest since March 2009, from 9 percent. Non-farm payrolls climbed 120,000, with more than half the hiring coming from retailers and temporary help agencies. Also, they revised October from 80,000 to100,000 in new jobs created.


With today's good jobs #, we are going to hear a lot of political posturing from both sides, but mostly the President, so my comment today focuses on market performance of Presidents in their 3rd Year of the 1st Term. The first chart below from Global Macro Monitor illustrates that since WW II, every President has had the S&P 500 rise in their 3rd Year of their 1st term. This throws more fuel into my thesis that the market is going to rally into the year-end, and Obama will end up having the S&P 500 in the black by the end of this year.
Another proof point that investors have pointed to concerning a December rally, is that the S&P 500 appears to be tracking the 1971 analog, also the third year of a first term President. Ironically, 1971 was also a year of similar currency turmoil as President Nixon officially ended the gold standard and the Breton Woods international monetary system in the middle of August. During a massive run on gold, then Treasury Secretary John Connally and Under Secretary for Monetary Affairs Paul Volcker advised the President to let the dollar float, effectively making it a fiat currency. This caused panic in the global markets until other countries let their currencies go.
History is rhyming here with our own Euro crisis and sovereign debt crisis. Let’s hope we get a similar spike up as we did in 1971 and 1991 and Santa brings us a nice rally to end the year.

Thurs 12.1.11
Kevin's note today reiterates what I have been saying about yesterday's intervention from the central bankers....that it only fixed the liquidity problem, and not the solvency problem for the European sovereigns.
On a more positive note, since it's December 1st, I thought I would share a chart from ThomsonReuters which illustrates that since 1971, on average December has been the best month for equities, at least according to the MSCI World Index, which includes both developed and emerging markets. It really gets to the psyche of investing, in that investors love to rally into the year-end, in hopes of beginning the new year on a high note.
On a more positive note, since it's December 1st, I thought I would share a chart from ThomsonReuters which illustrates that since 1971, on average December has been the best month for equities, at least according to the MSCI World Index, which includes both developed and emerging markets. It really gets to the psyche of investing, in that investors love to rally into the year-end, in hopes of beginning the new year on a high note.
| |
Subscribe to:
Posts (Atom)